Live Monitoring of Outbound Campaign
Here, Group Manager can monitor the activities in Outbound Campaign.
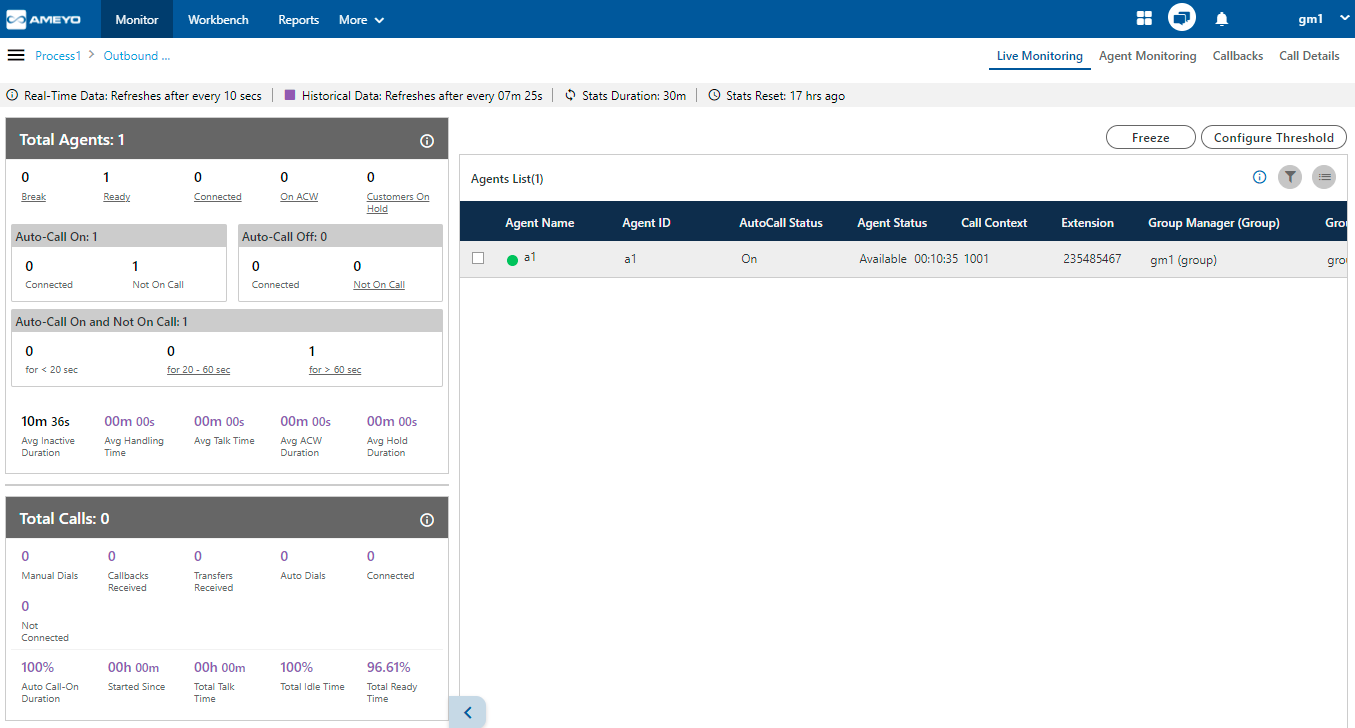
Figure: Live Monitoring
Interface Elements
Overall, the interface of Live Monitoring in Outbound Campaign can be divided into the following sections.
Cautionary Extension Selection Message
At the top of the screen, a cautionary message is displaying in the red bar.It arises in the case when the Group Manager does not select the extension of his phone. Select the extension to remove this cautionary mark from the screen.
You can also click on this cautionary bar to select the extension.

Figure: Cautionary Mark
Data Collection Indications
On top, a horizontal bar shows the indications of different data collection intervals.

Figure: Data Collection Indications
Real-Time Data: The statistics which are given in the black font color will update its data in every 10seconds. . Generally, the data shown in this color has a real-time impact on the database like Agent’s activity.
Historical Data: The statistics which are in the Purple font color refreshes after every 5minutes. Generally, the data shown in this color do not impact the database in every instance of the database.
Stats Duration: It shows that the data showing on the monitor screen is of the last 30 minutes.
Stats Reset: It is the indication about the time before which the monitoring data was refreshed.
Total Calls: Campaign Runtime Summary
It shows the runtime summary of all calls made in this campaign.
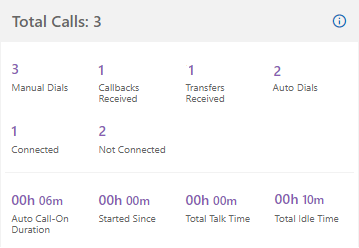
Figure: Campaign Runtime Summary
Additional Information:
Hover the mouse over ![]() icon to view the last calculated time, and last fetched time of "Total Calls".
icon to view the last calculated time, and last fetched time of "Total Calls".

Figure: Further Information of Total Calls
It contains the following metrics.
Manual Dials
Callbacks Received
Transfers Received
Auto Dials
Connected
Not Connected
Auto-Call On Duration
Started Since
Total Talk Time
Total Idle Time
Manual Dials
It shows the total number of manual dial and manual preview dial calls by the members of that group in this campaign.
It shows the data of the last 30 minutes. The Data Refresh Interval on the User Interface is maximum 5 to 10 seconds.
Callbacks Received
It shows the total number of callbacks received by the members of that group, including Queue Callback, Campaign Callback, Self Callback, and Preview Callback in this campaign.
It shows the data of the last 30 minutes. The Data Refresh Interval on the User Interface is maximum 5 to 10 seconds.
Auto Dials
It shows the total number of auto-dial calls by the members of that group made in this campaign.
It shows the data of the last 30 minutes. The Data Refresh Interval on the User Interface is maximum 5 to 10 seconds.
Transfers Received
It shows the total number of transferred calls received by the members of that group in this campaign.
It shows the data of the last 30 minutes. The Data Refresh Interval on the User Interface is maximum 5 to 10 seconds.
Connected
It shows the total number of unique connected calls by the members of that group in this campaign.
It shows the data of the last 30 minutes. The Data Refresh Interval on the User Interface is maximum 5 to 10 seconds.
Not Connected
It shows the total number of not connected calls in that group. The not connected status shows when the user assigned in that group is identified but the call fails to be connected.
It shows the data of the last 30 minutes. The Data Refresh Interval on the User Interface is maximum 5 to 10 seconds.
For the following cases the Not Connected status will not show:
1. If the call is not picked by the member of that group.
2. If the User ring timed out.
Auto-Call On Duration
It is the total time duration of all agents in that group who are on "Auto-call On" status for the last 30 minutes.
The Data Refresh Interval on the User Interface is maximum 5 to 10 seconds.
Started Since
It shows the time from when the agent started the calling. The time starts after the agent changed his status to "Available" only.
The Data Refresh Interval on the User Interface is maximum 5 to 10 seconds.
Total Talk Time
It is the total time duration of all agents of that group which they consume on the calling.
The Data Refresh Interval on the User Interface is maximum 5 to 10 seconds.
Total Idle Time
It shows the total time duration of all the agents of that group which they consume without calling.
If an agent has selected multiple campaigns and handling all calls in one campaign only, then it's Idle Time will be equal to the Ready Duration in other campaigns.
Calculation:
Idle Time |
= |
Ready |
— |
Agent Ringing Time for all calls taken by this agent in this campaign |
Total Agents: User Runtime Summary
It shows the Runtime summary for logged on users.
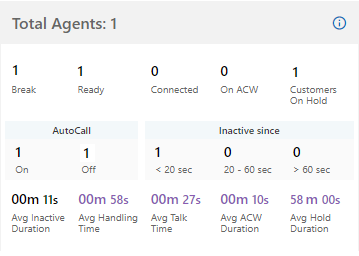
Figure: User Runtime Summary
It shows the current data. The Data Refresh Interval on the User Interface is maximum 5 to 10 seconds.
Additional Information:
Hover the mouse over ![]() icon to view the last calculated time, and last fetched time of "Total Agents".
icon to view the last calculated time, and last fetched time of "Total Agents".

Figure: Further Information of Total Agents
It contains the following metrics.
Break
Ready
Connected
On ACW
Customers on Hold
Auto-Call On and Not on Call
Auto Call On and Auto Call Off
Avg Inactive Duration
Avg Handling Time
Avg Talk Time
Avg ACW Duration
Avg Hold Duration
Break
It shows the number of users who are on break in that group. It is calculated for every user is equal.

Figure: Calculation of Break
It is a click-able entity. Once you click "Break" wizard, the filter group of the dashboard page activates and the Agent list comes up according to the selected parameters.
It shows the current data. The Data Refresh Interval on the User Interface is maximum 5 to 10 seconds.
Ready
It is the number of unique agents staffed in that group, who are on "Available" status. It is a click-able entity. Once you click on "Ready" wizard, the filter group of the dashboard page activates and the Agent list comes up according to the selected parameters.
It shows the current data. The Data Refresh Interval on the User Interface is maximum 5 to 10 seconds.
Connected
It is the total number of phone extensions selected by the users of that group which are connected in this campaign. It is a click-able entity. Once you click on "Connected" wizard, the filter group of the dashboard page activates and the Agent list comes up according to the selected parameters.
It shows the current data. The Data Refresh Interval on the User Interface is maximum 5 to 10 seconds.
On ACW
It is the number of agents of that group who are on "Wrap Up" of the calls, that is, who are disposing the calls. It is a click-able entity. Once you click on "On ACW" wizard, the filter group of the dashboard page activates and the Agent list comes up according to the selected parameters.It shows the current data. The Data Refresh Interval on the User Interface is maximum 5 to 10 seconds.
Customers on Hold
It is the number of agents of that group who have put their customers on hold even if they are in conference. In the case of the conference where both agents had put the customer on hold, "on hold" count will include both agents. It is a click-able entity. Once you click on "Customers on Hold" wizard, the filter group of the dashboard page activates and the Agent list comes up according to the selected parameters.
It shows the current data. The Data Refresh Interval on the User Interface is maximum 5 to 10 seconds.
"Auto Call On" and "Auto Call Off"
The Auto Call On metric shows the count of connected and not on call agents whose auto-call status is enabled. Likewise, Auto-Call Off metric shows the count of agents whose Auto-call status is off and are either connected to the call or not on the call.

Figure: Auto Call On and Auto Call Off Agent count
Auto-Call On and Not on Call
"Auto-Call On and Not on Call" are the number of agents whose Auto Call status is On but they are not on any call. It includes an agent only when its status is set as "Auto-Call On" and "Available".
Example: It includes only the current status for all the calculations, that is, if the user (with "Available" and "Auto-Call On" status) is not getting a call from last 60 seconds, and it switched to break for 5 seconds, then after coming back from break, that agent will be seen inactive in "<20sec" field, the last 60 seconds is lost. The count will decrease when the agent selects any break or sets its Auto-Call status as "OFF." The count will increase when the agent selects available after coming from any break or sets its Auto-Call Status as "ON."
It shows the inactive agents in the following intervals.
-
<20 sec: It is the total number of agents who are on "Auto-Call On" status and waiting for the calls for less than 20 seconds.
It shows the current data. The Data Refresh Interval on the User Interface is maximum 5 to 10 seconds.
-
20-60 sec: It is the total number of agents who are on "Auto-Call On" status and waiting for the calls from the last 20 to 60 seconds.
It shows the current data. The Data Refresh Interval on the User Interface is maximum 5 to 10 seconds.
-
>60 sec: It is the total number of agents who are on "Auto-Call On" status and waiting for the calls for more than 60 seconds.
It shows the current data. The Data Refresh Interval on the User Interface is maximum 5 to 10 seconds.
Avg Inactive Duration
It is the average wait time per user of all the agents assigned in that group. It means that the Total wait time / Total Users of that group.
It shows the real time data. The Data Refresh Interval on the User Interface is maximum 5 to 10 seconds.
Avg Handling Time
It is equal to the sum of Customer Talk Time, Customer Hold Time for, and Wrap Time of Connected Calls divided by the total connected calls by the agents of that group. It includes only Customer Interactions, but Dial User (Internal Calls) are not included.
Calculation :

Figure: Calculation of Avg Handling Time
AHT does not include the Average Wrap Time of an agent as the Average Wrap Time will also include the wrapping up of not connected calls.
It shows the data of the last 30 minutes. The Data Refresh Interval on the User Interface is maximum 5 to 10 seconds.
Avg Talk Time
It is equal to the total time (in seconds) spent by the agents of that group while talking to the customers divided by the total number of answered customer calls in this campaign of by the users of group.

Figure: Calculation of Avg Talk Time Duration
It shows the data of the last 30 minutes. The Data Refresh Interval on the User Interface is maximum 5 to 10 seconds.
Avg ACW Duration
It is the average amount of time spent by all the agents of the group in disposing the calls.It represents the average time taken by the Agents to dispose the calls.
It shows the data of the last 30 minutes. The Data Refresh Interval on the User Interface is maximum 5 to 10 seconds.
Avg Hold Duration
It is equal to the total hold time divided by the count of customer calls with holds.
Calculation:

Figure: Calculation of Avg Hold Duration
It shows the data of the last 30 minutes. The Data Refresh Interval on the User Interface is maximum 5 to 10 seconds.
Agent List
Here, the Group Manager can view the live status of Agents who are staffed to this campaign and are attending calls. The Group Manager can monitor the calls on runtime also.

Figure: Agent List
It contains the following columns.
-
Agent Name: It shows the usernames of the agents who have been assigned in the selected campaign.
It shows the current data. The Data Refresh Interval on the User Interface is maximum 5-10 seconds.
-
Agent ID: It shows the IDs of the agents who have been assigned in the selected campaigns.
It shows the current data. The Data Refresh Interval on the User Interface is maximum 5-10 seconds.
-
Extension:It shows the extension selected by an agent or assigned forcefully to an agent.
It shows the current data. The Data Refresh Interval on the User Interface is maximum 5-10 seconds.
-
Auto Call Status: It shows the auto-call status of an agent.
It shows the current data. The Data Refresh Interval on the User Interface is maximum 5-10 seconds.
-
Agent Status: It shows the status of an agent and the duration since when the agent is on this status.
It shows the current data. The Data Refresh Interval on the User Interface is maximum 5-10 seconds.
-
Call Context: It shows the call context assigned to an agent.
It shows the current data. The Data Refresh Interval on the User Interface is maximum 5-10 seconds.
-
Agent Call Status: It shows the call status of an agent. If the agent is on dial user (internal call) or connected on call in other campaign, the columns (call type, customer info, customer status, and queue) will remain blank. There is no feature for the Group Manager to identify such calls.
It shows the current data. The Data Refresh Interval on the User Interface is maximum 5-10 seconds.
-
Call Type: It shows the type of call, which is connected with the agent at present.
If the agent is on dial user (internal call) or connected on call in other campaign, the columns (call type, customer info, customer status, and queue) will remain blank. There is no feature for the Group Manager to identify such calls.It shows the current data. The Data Refresh Interval on the User Interface is maximum 5-10 seconds.
-
Phone: It shows the customer information. As of now, the call context is being displayed in case of Outbound calls where the phone number is being displayed in case of manual dial calls.
It shows the current data. The Data Refresh Interval on the User Interface is maximum 5-10 seconds.
-
Customer Call Status: It shows the status of the call of the customer.
It shows the current data. The Data Refresh Interval on the User Interface is maximum 5-10 seconds.
-
Queue: It shows the name of queue in which the Outbound call has arrived. Even if the agent has been assigned in the multiple queues, still the name of that queue will be displayed in which the agent is connected to the customer.
It shows the current data. The Data Refresh Interval on the User Interface is maximum 5-10 seconds.
Agent Availability: The status of agent is shown with the agent's name in the form of green
 or red
  circle(here "a1" and "a2" are the agent names). If the status of agent is available then the green circle starts showing with the agent's name and if the agent is status is unavailable or the agent is on break then the status of the agent shows with red mark. Through this feature, the group manager can easily recognize that whether the agent is available or not.
Group Manager: It shows the name of the group manager under which the agent is assigned into.
Groups: It shows the name of the groups in which the agent is assigned into.
Table Filters: It shows the name table filter name when the masking feature is enabled.
The status of agent will show only when the agent logged-in to the Ameyo and till the time agent do not logged off his profile.
If any agent is on call through Dial User App, then the metrics like Call TYpe, Phone, Customer Call Status, and Queue in Agent List will remain blank. However, the Agent Call Status should remain "Connected".

Figure: Status of Agents who are on call using Dial User App
Operations
Here, the Group Manager can perform the following operations.
Break
The Group Manager can click on this button. Clicking on this button shows the list of Agents who are on the break and the duration of their break status. Break operation shows the same concerned Agents List in which the status all the Agents who are on the Break will show.

Figure: Break Operation
Ready
The Group Manager can click on this button. Clicking on this button shows the list of Agents who are Ready to take the calls. Ready operation shows the same concerned Agents List in which the status of all the Agents who are Ready to take calls will show.

Figure: Ready Operation
Connected
The Group Manager can click on this button. Clicking on this button shows the list of Agents who are connected on the phone call with the Customers. Connected operation shows the Agents List in which all the Agents who have connected all the calls with customers will show.

Figure: Connected Operation
On ACW
The Group Manager can click on this button. Clicking on this button shows the list of Agents who are disposing of the calls which they just completed. On ACW operation shows the complete Agents List who are disposing of their calls in the Ameyo.

Figure: On ACW Operation
Customers on hold
The Group Manager can click on this button. Clicking on this button shows the list of Agents who put their customers on hold. Customers On Hold shows the complete list of Agents who put the customers call on Hold.

Figure: Customers on Hold Operation
(Licensable) Configure Call Duration Threshold
Group Manager can configure the threshold value of Call Duration time for the agents assigned in the same campaign.
This feature is licensable, hence contact your administrator for further information on same.
Following are the types of threshold values in outbound campaign.
Hold Time Breached: It is the threshold limit for Customer Hold Time. The hold time for a call should not exceed the provided threshold limit. When the agent breached the time limit then the color of the agent list for that agent shows in
 .
.If the agent exceeds the hold time limit the color of the agent turns to the hold time breached color, but the moment he resumes the call, the color of the agent again turns to white. In the same way, if the agent put the call on hold multiple times then the agent list call status turns to the respective colors again and again, which signifies that the agent status color depends on the status of his call on runtime. The color of the agent list for call status is runtime.
ACW Time Breached: ACW stands for After Call Work. It is the threshold time within which the call should be disposed of after the disconnection. ACW Time for any call should not exceed the defined threshold limit. When the agent breached the time limit then the color of the agent list for that agent shows in
 .
.Call Duration Breached: It is the threshold for Call Duration, which is the sum of both Customer Talk Time and Customer Hold Time. The Call Duration for any call should not exceed the threshold limit. When the agent breached the time limit then the color of the agent list for that agent shows in
 .
.Break Duration Breached: It is the threshold limit for the break duration. The break duration for the agent cannot be greater than the provided time limit by the Group Manager. When the agent breached the time limit for break duration, then the color of that agent in the agent list shows with the color which was configured in the color configuration of break duration at process level.
Perform the following steps to configure threshold values for agents.
Click "Configure Threshold" button present in the "Agent List" bar. It shows the following wizard.
Enter the value of "Hold TIme" and "ACW Time" and "Call Duration Time" which you want to set for the agents.
Enter the time limit for the break duration reasons. You can enter the different threshold value for every break reason.
Select the time method, that is, the values are either in minutes or in seconds from the drop down list.
Click "Apply" button to continue or click "Cancel" button to cancel the changes made.
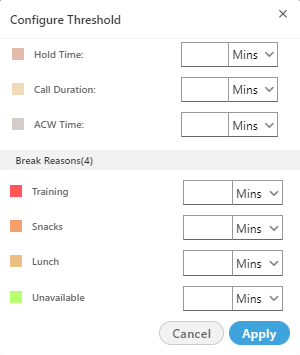
Figure: Configure Threshold Values
After configuring the threshold values, the status starts coming in the "Agent List" wizard of window.

Figure: Threshold value Status
The color of the threshold for the agent who breached the break reason time depends on the color configured at process lever in "Color configuration" tab. Know more...
Freeze or Unfreeze
You can click "Freeze" to freeze "Live Monitoring" Tab at any point of time. No update in any graph or report will be reflected. You have to click "Unfreeze" unfreeze "Live Monitoring" Tab and let it receive latest updates.
Filter
Group Manager can click ![]() icon to filter the data as per the available filters.
icon to filter the data as per the available filters.
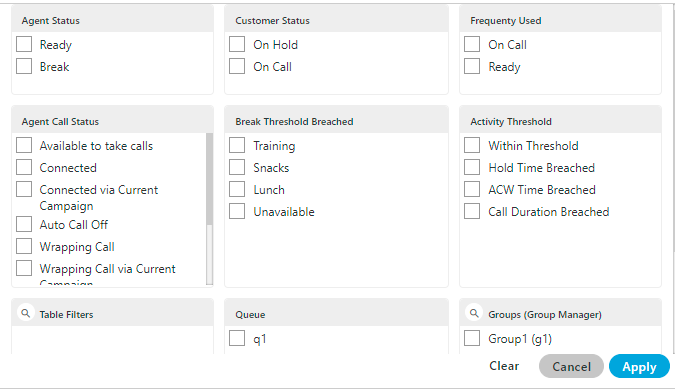
Figure: Filtration
The Group Manager can select the single or multiple filters from the following list.
Customer Status : The Group Manager can select the status of the customer either the customer is on the call or on the Hold.
On Call : It means that the agent is on the call with the customer.
On hold : It means that the agent is either not active on the call or the agent put the customer's call on hold.
Frequently Used : It shows the frequently used filters which are used by the group managers mostly.
Agent Status: It filter the agents based on the status of their work, that is, whether the agent is ready or is on the break. It contains the following options.
Ready: It shows the agents who are ready to attend the calls.
Break: It shows the agents who are on break.
If the agent is automatically set on "Auto Available" just after the logon, then the break count will be increased by 1.
Agent Call Status : The Group Manager can filter the status of the agents from the following status.
Available to take calls : It means that the agent is free and available to take the next call.
Connected : It means that the agent is connected with the campaign and also selected the extension.
Connected via current campaign : It filters those agents which are connected with the campaign in which the Group Manager is connected at that time.
Auto Call Off : It shows that the agent is not on the auto call or the auto call for those agents are off.
Wrapping Call : It filters for those agents who are wrapping-up their calls or agents who are disposing off their calls.
Wrapping Call via current campaign : It filters for those agents who are wrapping-up their calls with the current campaign with which the Group Manager is logged-in at the same time.
Activity Threshold : It allows the Group Manager to filter for those call which are in the various threshold range. It contains the following parameters which can be used to filter the list.
Within Threshold: It filter the list of those agents which are lying in the threshold limit set by the administrator.
Hold Time Breached: It filters the list of those agents who breached the hold time limit set by the administrator.
ACW Time Breached: It filters the list of agents who breached the time limit to dispose off the call which is set by the administrator.
Call Duration Breached: It filters the list of agents who breached the limit of Call duration which is set by the administrator as well.
Break Threshold Breached :The Group Manager can search those users whose status is on break and the break time configured by the Group Manager has already been breached. It contains all the break reason which are configured in the system by the administrator.
Queue : The Group Manager can filter for particular agents which are assigned in the particular queue.
Monitoring a Call
Group Manager can click any on any record on live monitoring screen to access a floating window.

Figure: Live Monitoring of a Call
It will show agent name, status (inactive/ connected/ hung up), Customer Details (on clicking on this, CRM gets open in preview mode) along with below mentioned tabs.
Session Details
Calls: Count of Autodial (in case of Outbound campaign)/ Outbound (in case of Outbound campaign), Manual and Callback calls.
Duration: Total Ready, Auto-call (Auto-call On) and Talk (talk time) duration.
Dispositions: It shows top 3 dispositions.
Call Details
-
Customer: It will show Details (customer's phone number), Status (inactive/ connected/ hung up) and Duration (talk time).
-
Details: It will show Campaign (Campaign name in which the call has been received/ from which call has been dialed), Lead (Lead Name in case of Outbound campaign) / Queue (Queue Name in case of Outbound campaign) and Call Type (Outbound/auto dial/manual dial).
Monitoring Operations
Group Manager can snoop, whisper, and disconnects the call using the buttons provided at the bottom of the floating panel. These buttons will only get highlighted in case the agent is on a call except Force Logout (which will be highlighted irrespective whether the agent is on call or not). Group Manager can minimize or maximize floating window using up and down arrow icons respectively.
Snoop
This feature can be used if Group Manager wants to listen to the conversation of agent and customer on live call. Group Manager needs to follow below steps to snoop a call.
-
Select the record of an agent who is on a live call, the floating window will open with the
 button enabled.
 -
Click on Snoop button to connect in between the call in Snooping mode.
-
While snooping a call, both agent and caller will remain unaware of Group Manager’s activity.
-
To end the snoop call, click same button again.
Whisper
This feature can be used if Group Manager wants to guide agent on call. Group Manager can connect in between the live call and can assist agent accordingly. Group Manager needs to follow below steps.
-
Select the record of an agent who is on a live call, the floating window will open with the
 button enabled.
 -
Click Whisper button to connect in between the call in Whisper mode.
-
Customer will only hear the voice of the agent (not the Group Manager).
-
The Group Manager can end whisper call by clicking the same button again.
Conference
This feature can be used if Group Manager wants to force confer a live call. Group Manager needs to follow the below steps to force confer a call.
-
Select the record of an agent who is on a live call, the floating window will open with the
 button enabled.
 -
Click confer button to connect in between the call.
-
The Group Manager can end the conference call by clicking the same button again.
If "Confer Call" privilege has been masked for a Group Manager, then "Call Conference" for that Group Manager will also be masked in the modal of call monitoring of "Live Monitoring" Tab.
It is a Campaign-level Privilege, which can be configured by Administrator and Group Manager. The change made by a Group Manager for this privilege will override the privilege configured by the Administrator.
Barge
-
Select the record of an agent who is on a live call, the floating window will open with the
 button enabled.
 -
Click barge button to connect in between the call.
-
CRM will be popped up on Group Manager workbench automatically.
-
Now, Group Manager is the owner of the call and can dispose the call by selecting a disposition. Agent can still listen to the conversation of customer and Group Manager on mute-mode. Note that agent goes on Mute-mode automatically during barge.
Disconnect
Group Manager can force Disconnect the live call of any agent by clicking on ![]() icon. Both customer's and agent's channel will be disconnected.
icon. Both customer's and agent's channel will be disconnected.
Force Logout an Agent
The Group Manager can force logout an agent from the system at any moment.
-
Select the record of the required agent in live monitoring screen, the floating window opens up.
-
The Group Manager can click
 icon to logout a user forcefully. The following pop-up is displayed on the screen.
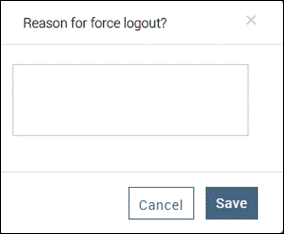
Figure: Force Logout Reason
-
Here, Group Manager has to provide the reason for the force logout of agent.
-
After entering the reason, the Group Manager needs to provide confirmation on session termination by clicking on "Save" button.
-
After Group Manager's confirmation, the agent will be logged out from Ameyo forcefully.